Agri-food-nature Transition Model (ATM) (2019-now)


In 2019, a consortium of partners in the Dutch agri-food sector came together to develop a new tool that would facilitate finding pathways to sustainable food production and consumption in the Netherlands. There was a need for a tool that would be accepted widely in the field by actors with different interests to shift the discussion from a disagreement over the suitability of tools to sketching the transition. There is a wide array of models for the agricultural and food system, but simulation models available for the Netherlands that would be open access and open data, include the entire supply chain in an integral manner (agricultural production, food processing, food consumption) and with sufficient detail (e.g., adequate number of crops to represent the Dutch system) were not available. In 2019 we built the first prototype of the model. Since then, the model has been expanded and improved as a part of the Fascinating-project of the province of Groningen. The result of the development is an open-access, open-data tool that is free to use through an online user interface.
The model considers the complete and integral agriculture, food and nature system of The Netherlands. We have divided this into 3 perspectives or subsystems, which are connected but vary hugely. The first is that of agricultural production. Here we look at biomass production (as plants) as well as animal production. In the third perspective we look at the apparent biomass consumption, as food, energy and feedstock. And in the middle we find the processing and trade system. Within this system, the model considers (for now) key macronutrients like nitrogen, phosphor and potassium, water, weather profiles, energy, emissions (carbon and nitrogen), land footprint and biodiversity, among other things.
The base year of the model is 2017. For the base year, three perspectives (agricultural production, primary food processing and apparent food consumption) were built bottom-up. These perspectives are interconnected but independent. By making changes to the base-year situation of the perspectives the user can explore possible future systems and their outcomes. All the functionalities are available for two scopes: the Netherlands and the province of Groningen.
Agricultural production includes both the cultivation of animals as well as animal husbandry. The user can make changes to both the production volumes (cultivation areas of crops and headcount of animals) and the manner of production (e.g., nutrient provision or type of feed). In the food processing perspective, the user can change the volumes of food products processed in the Netherlands. Furthermore, in the biofeedstock and energy production, the user can choose to direct agricultural residues into the production of green gas or hydrogen. In the food consumption perspective, the user can make changes to the average diet in the Netherlands.
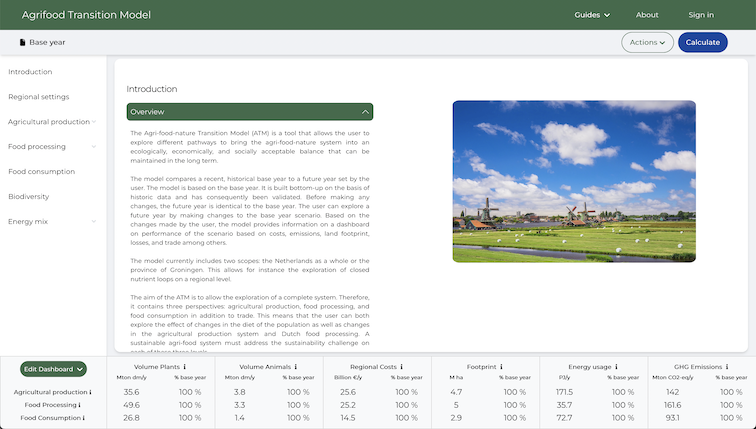
The dashboard with its indicators and the graphs and tables provides the user information on the outcomes of their scenario. Indicators report the outcomes separately for each perspective. Indicators include the volume of plants and animals, land footprint, greenhouse gas emissions, water use, fertiliser use, nutrient losses, and health value of the diet (NRF9.3).
Following the rounding up of the third phase of development, we have used the ATM to calculate scenarios for clients. For Meststoffen Nederland we explored the effects of the Netherlands losing the derogation relating to the Nitrate Directive. For Stichting Sanegeest, we made calculation relating to the footprint of the fastfood industry. And for Urgenda, we employed the ATM to create a first integral and quantitative scenario of a future Dutch food system. Even though the model has proved to be a useful tool in making scenarios for the future Dutch agricultural and food system, a model never exhausts possible further developments.
The model is open access and free of charge, which means that anyone can use it to explore how the Dutch agri-food system reacts to changes in different parts of the system. The model can be accessed through the website agrifoodtransitionmodel.com. A user guide for the model as well as technical documentation are available within the model, too.